
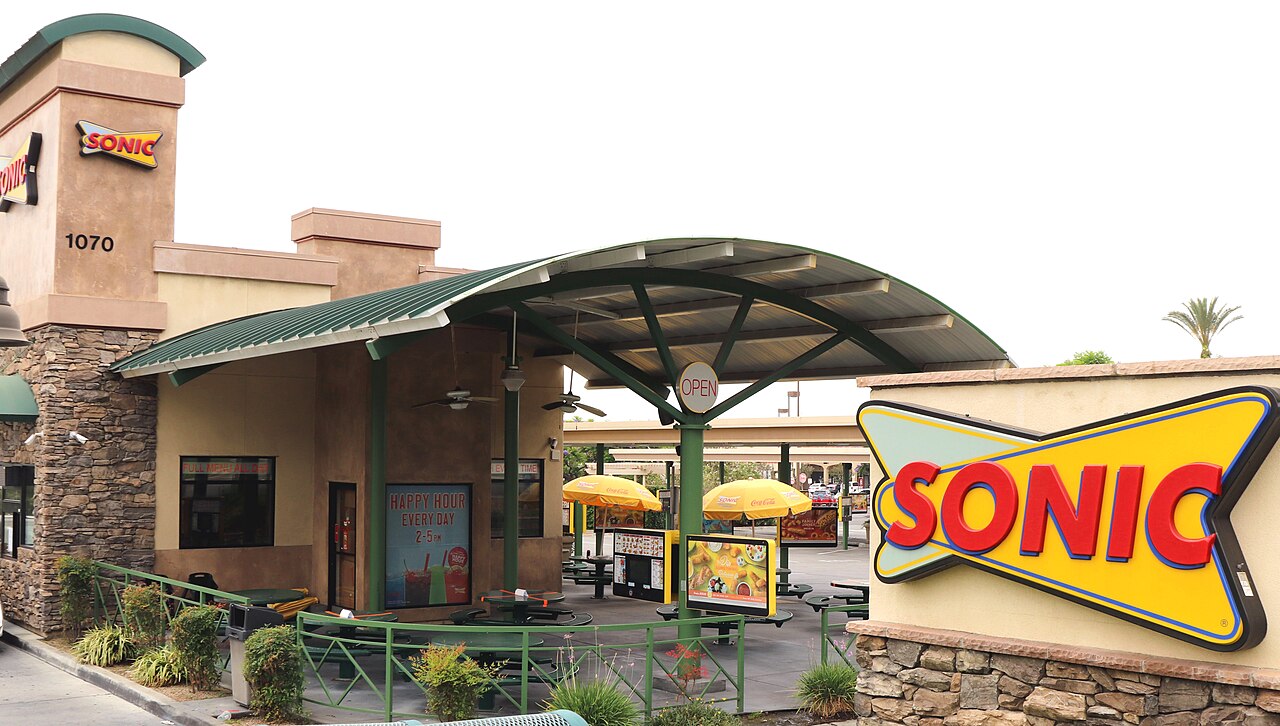
Oklahoma may not have the biggest raw count of Sonic Drive-In restaurants, but it appears to have the deepest per-person footprint. When location totals are adjusted for population, the state stands out more than any other in the country.
Why Oklahoma stands out in the Sonic count
A StoreLocationData report dated October 8, 2026, listed 3,357 Sonic restaurants across 47 states, according to the NewsBreak source material provided. Texas led the country by total count with 895 locations, followed by Oklahoma with 257, Tennessee with 219, Arkansas with 190, and Missouri with 183.
That raw ranking only tells part of the story. Once those store counts are compared with state population figures, Oklahoma moves to the top. The source material says Oklahoma’s 257 Sonic locations work out to 6.23 restaurants per 100,000 residents, using U.S. Census Bureau July 1, 2025 population estimates.
Arkansas was a very close second at 6.10 locations per 100,000 residents, with Kansas third at 4.40. Mississippi, Louisiana, and New Mexico also ranked ahead of several larger states on a per-capita basis. The pattern suggests Sonic’s restaurant base is especially concentrated in the South and central United States, rather than spread evenly coast to coast.
Texas is bigger, but Oklahoma is denser
Texas still dominates the chain in sheer scale. The source material says the state has 895 Sonic locations, more than three times Oklahoma’s 257. But because Texas also has a much larger population, its per-capita figure falls to 2.82 locations per 100,000 residents, placing it ninth on that measure.
That contrast is what makes Oklahoma notable. A shopper driving across Oklahoma is simply more likely to run into a Sonic than someone making the same kind of trip in Texas, even though Texas has far more total stores. For home cooks and families, that helps explain why Sonic can feel like a routine neighborhood stop in some states and much less common in others.
The Census Bureau’s Vintage 2025 population estimates confirm that Texas had an estimated population of 31,709,821 on July 1, 2025, while Oklahoma’s was 4,123,288. Those differences matter when comparing restaurant access across states, and they help explain why total store counts and per-capita rankings can point to different winners.
What the rankings do, and do not, show
These figures say something useful about availability, but not everything about customer behavior. The NewsBreak source notes that the rankings measure restaurant availability relative to population, not sales, traffic, or how often people actually order from Sonic.
That distinction matters. A high per-capita count does not prove that Oklahoma residents buy more burgers, drinks, or slushes than anyone else. It does suggest that the chain has a particularly strong physical presence there, which can shape how familiar it feels in everyday life.
The same source highlights a few other notable contrasts. Florida made the top 10 in total locations with 88 stores, but had only about 0.38 Sonic restaurants per 100,000 residents. California, despite its size, had 80 locations and did not make the top 10 by total count. Three states, Maine, New Hampshire, and Vermont, had no Sonic locations listed in that October snapshot.