
This Pizza Chain Just Got Named Best in America, And Almost No One Saw It Coming

National pizza rankings often tilt toward the biggest brands by sales, store count, or visibility. This time, the surprise came from a customer-satisfaction study that elevated two familiar chains rather than the category’s usual headline-grabber. In the American Customer Satisfaction Index Restaurant and Food Delivery Study 2026, released June 24, Papa Johns and Pizza Hut tied for the top score among pizza chains.

A national ranking produced an unexpected tie at the top

The American Customer Satisfaction Index, or ACSI, said in its 2026 Restaurant and Food Delivery Study that Papa Johns and Pizza Hut again shared the lead among pizza chains with scores of 80. The report placed Domino’s just behind the co-leaders, with Little Caesars also close in the category. That made the result notable because the best-known national pizza conversation often centers on Domino’s scale and performance, not a tie between Papa Johns and Pizza Hut.

The June 24, 2026 study was based on 16,464 completed surveys, according to ACSI’s published methodology. In the pizza section, ACSI said customers responded favorably to menu variety at the leading brands, while Little Caesars continued to benefit from its value positioning. The study did not frame the category around sales or unit count, but around customer experience and satisfaction.

That distinction matters. Other industry scorecards, including sales-based restaurant rankings, measure different things and can produce very different winners. In this case, ACSI’s finding was narrower but still significant: on customer satisfaction, Papa Johns and Pizza Hut finished first in the pizza-chain segment in 2026, according to the index.

What the result means across U.S. markets

Because ACSI reports by brand and category rather than by city or state, the study does not identify which local markets pushed Papa Johns or Pizza Hut to the top. The organization has not released a state-by-state or city-level breakout showing whether the strongest scores came from the South, Midwest, Northeast, or West. That means there is no verified public list of the specific metros where the co-leading pizza chains overperformed.

What is confirmed is that this was a national consumer survey, not a regional taste test or a ranking based on one publication’s editors. That gives the result broader weight for chains with large U.S. footprints. It also means customers in major pizza markets, including New York, Chicago, Dallas, Phoenix, Atlanta, and Orlando, were folded into the same national measurement rather than judged as separate competitive fields.

The study also does not provide store-level implications such as remodel plans, menu changes, or expansion tied to the ranking. Neither ACSI’s report nor the publicly available study materials say the result will change pricing, delivery strategy, or franchise development in any one state. For now, the measurable takeaway is the national score itself and the fact that the top spot was shared.

Why these brands rose in a crowded pizza category

ACSI attributed the pizza leaders’ performance in part to menu variety. In the 2026 study, the organization said customers were responding favorably to the variety of options offered by the leading pizza chains. That suggests the category is being judged on more than speed or price alone, especially as national brands compete across carryout, delivery, digital ordering, and limited-time offers.

The same report said the competitive set for pizza has evolved as chicken gains popularity, convenience stores expand their pizza offerings, and food-delivery options continue to grow rapidly. In other words, pizza chains are not only competing with each other. They are also competing with adjacent prepared-food operators and third-party delivery habits that give diners more substitutes than they had a decade ago.

For customers, the practical impact is straightforward. The 2026 study indicates that Papa Johns and Pizza Hut are currently setting the pace in customer satisfaction among major pizza chains, while Domino’s remains close behind in the same category. ACSI’s report stops there: it identifies the leaders, explains some of the competitive pressure shaping the segment, and leaves future brand responses to subsequent earnings reports, customer surveys, and chain performance data.

Meet the Low-ABV Beer That Beat Out Everyone Else This Year

Low- and no-alcohol beer has become one of the most closely watched segments in the global drinks business as major brewers and specialty producers race to win over consumers seeking moderation without leaving beer behind. This year, that competition narrowed to one standout label from Bayreuth, Germany: Maisel’s Weisse Alkoholfrei. On August 12, 2026, the World Beer Awards named it the World’s Best No & Low Alcohol Beer.

Maisel’s Weisse Alkoholfrei took the top no- and low-alcohol title

The specific winner was Maisel’s Weisse Alkoholfrei, a wheat beer from Brauerei Gebr. Maisel in Bayreuth, Germany. The World Beer Awards confirmed on August 12 that the beer won the 2026 title for World’s Best No & Low Alcohol Beer, placing it at the top of the competition’s global final round. In the same awards roundup, the organizers also listed category-wide World’s Best winners across dark beer, IPA, lager, pale beer, sour and wild beer, specialty beer, stout and porter, and wheat beer, underscoring the scale of the judging field.

The awards site separately identified Maisel’s Weisse Alkoholfrei as the 2026 World’s Best No & Low Alcohol Wheat Beer. Company materials describe the beer as an alcohol-free wheat beer made with a proprietary brewing process, and prior World Beer Awards materials listed the product at 0.3% ABV. That places it squarely in the low-ABV and alcohol-free-adjacent segment now crowded with entries from multinational brands and smaller breweries alike.

The result matters because the World Beer Awards do not present this category as a niche side contest. The 2026 winners pages show gold, silver and bronze medalists across multiple no- and low-alcohol style classes, including dark, specialty and wheat beer, with entries from countries including Germany, Belgium, Lithuania and Mexico. In practical terms, Maisel’s Weisse Alkoholfrei did not just win a wheat subcategory; it was elevated above the broader no- and low-alcohol field.

What the result means in the U.S. market

For U.S. readers, the immediate takeaway is product visibility rather than a confirmed nationwide rollout. Maisel’s Weisse is a long-established German wheat beer brand, but the brewery has not published a current, comprehensive U.S. distribution list for Maisel’s Weisse Alkoholfrei. Its consumer tools emphasize retailer lookup rather than a state-by-state public map, and the available official materials reviewed for this story do not confirm a full list of American markets carrying the beer.

That leaves several points unconfirmed. The company has not released confirmed counts of U.S. stores, bars or restaurants currently selling the alcohol-free wheat beer, and it has not publicly identified which American cities are receiving new allocations following the award. There is also no public statement, in the materials reviewed, announcing a U.S.-specific expansion tied directly to the August 12 result.

Still, the award gives importers, specialty bottle shops and beer programs a fresh credential to market. In the U.S., no- and low-alcohol beer has increasingly moved beyond Dry January displays into year-round shelf space, and global awards can influence what buyers choose to stock. For American consumers, the practical near-term impact is that a European label already known in beer circles now carries one of the category’s clearest international endorsements.

Why low-ABV beer is winning more attention now

The broader context is a category that has become more competitive and more technically ambitious. The World Beer Awards’ 2026 style guidelines maintain a dedicated no- and very-low-alcohol track, with formal style breakdowns that include dark, IPA, lager, pale, specialty and wheat beer. That structure reflects a market where low-ABV products are no longer treated as a single catchall format but as beers expected to meet style-specific standards.

Maisel’s own product description points to why some brewers are finding traction: process and style familiarity. The brewery says its alcohol-free wheat beer is made through a specially developed brewing method intended to preserve the fruity, spicy character associated with traditional weissbier. That is important in a segment where quality perceptions have historically lagged full-strength beer and where repeat purchases depend on delivering recognizable beer flavor, not simply lower alcohol.

For customers, the immediate meaning is straightforward. The year’s top no- and low-alcohol beer, as judged by the World Beer Awards, is a wheat beer rather than a pale lager or hop-forward IPA, a result that may broaden expectations about what styles can lead this segment. As of late August 2026, the award stands as an international benchmark for the category, while U.S. availability remains dependent on retailer and importer decisions rather than any announced national launch.

The Gins That Just Won the World’s Toughest Taste Test

Global spirits competitions remain one of the clearest signals of what producers and buyers are watching in premium liquor. This year, the World Gin Awards narrowed that focus to gin, with winners announced in London after months of judging that began with country-level tastings and ended with a global final.

The event: World Gin Awards names its 2026 global winners

The World Gin Awards announced its 2026 “World’s Best” winners on June 2, 2026, at its annual gala dinner in London, according to the awards program’s published medallists and country winners materials. The competition first named country winners on May 4, then advanced those bottles to the final round for the global titles, giving the awards a two-stage structure rather than a single tasting session. That format is one reason the program carries weight in the trade, because entrants must first win within their home markets before competing for the overall title.

The top overall honor, “World’s Best Gin,” went to Hernö Old Tom Gin of Sweden, according to the World Gin Awards winners list. In major style categories, the organization named BotaniskMeir Gin of Norway as World’s Best Classic Gin and Devil’s Grin Gin of the United States as World’s Best Contemporary Style Gin. The awards site also lists Jonomade Dolly’s Mix of England as World’s Best Flavoured Gin.

The published finalists document shows the breadth of the field. Entries advanced from countries including the United States, England, India, Italy, Brazil, Japan, Australia and Sweden, reflecting how far the category has expanded beyond its traditional UK base. The competition’s publicly posted tasting notes also show the judges scoring on aroma, palate balance and finish rather than marketing or packaging.

The state or local impact: The U.S. winner gives American gin a concrete result

For U.S. producers, the clearest confirmed result is Devil’s Grin Gin winning the World’s Best Contemporary Style Gin title after first being named the United States country winner in that category, according to the World Gin Awards results. The same results page lists Gray Whale Gin as a U.S. gold winner in contemporary style, Rainier Mountain Fresh Gin as a silver winner and Koala Bare Gin OLV No. 3 as a bronze winner. That makes the American showing notable not only for one champion bottle, but for a broader medal spread in a competitive style segment.

What is not yet publicly clear from the awards materials is a full state-by-state breakdown of every U.S. entrant or finalist across all gin styles. The organizers’ publicly available pages identify national winners and medalists by product name and country, but they do not publish a comprehensive U.S. map in the material reviewed for this story. In other words, the competition confirms American success, but not a complete geographic distribution of where every awarded U.S. gin is produced.

Still, the U.S. presence extends beyond one bottle. The flavoured gin results page lists 1000 Piers Winter Tide Gin of the United States with a silver medal, while the contemporary page confirms multiple U.S. placements. For American distillers and retailers, those verified results give buyers a current international benchmark tied to a named competition and dated awards cycle.

The cause or context: Why these awards matter in a crowded gin market

The broader context is that gin has become a more international and style-diverse category, and the 2026 winners reflect that shift. The World Gin Awards’ country-winner sheets show bottles from Norway, Sweden, England, India, Taiwan, Wales and the United States earning top placements across different styles, indicating that excellence is no longer concentrated in one legacy producing nation. Forbes, writing this summer about other 2026 gin competitions, similarly described today’s top gin field as geographically broad and driven by stylistic experimentation.

The awards structure also helps explain the attention these results receive. According to the World Gin Awards materials, producers compete within subcategories such as classic, contemporary, flavoured, London dry and limited edition, which allows judges to compare like with like before selecting global champions. That matters in a market where consumers and trade buyers are sorting through a much wider range of botanical profiles, production methods and price points than they were a decade ago.

For customers, the practical takeaway is straightforward: these awards identify bottles that have already cleared a blind-tasting process at both country and world level. Availability will still vary by market, and the awards body does not control U.S. retail distribution, but the June 2 world results and May 4 country results now provide a current reference point for stores, bars and importers deciding which gins to spotlight next.

The Real Reason Alcohol Makes You Crave Snacks

Alcohol remains a major part of dining, nightlife, and at-home entertaining across the U.S., and researchers have spent years studying how it shapes eating behavior as well as drinking behavior. The specific question behind the familiar “drunchies” effect is why people often reach for salty, high-fat snacks after even moderate drinking. A growing body of evidence points to a mix of biology and behavior rather than simple habit alone.

Alcohol changes appetite signals and reward pathways

Researchers have consistently found that alcohol can increase food intake even though it already supplies calories, a paradox documented in clinical and review literature. A review indexed by PubMed reported that people often do not reduce later food intake to compensate for alcohol’s energy content, which is one reason moderate drinking can add to overall calorie intake. More recent nutrition reviews have reached a similar conclusion, stating that alcohol can increase appetite, snack urge, and intake of energy-dense foods, especially savory high-fat foods.

One reason is the hormone ghrelin, which is closely tied to hunger and reward. Reviews in Physiology & Behavior and International Review of Neurobiology describe ghrelin as an appetite-stimulating signal that also appears to be involved in alcohol craving and alcohol-related reward. Human and animal studies summarized in those reviews suggest alcohol and ghrelin interact in brain regions linked to motivation, including the hypothalamus and mesolimbic dopamine system.

That means the body is not just processing a drink; it may also be shifting toward a state that makes rewarding foods look more appealing. A 2024 Neuropsychopharmacology study described ghrelin as a hormone that stimulates appetite and food intake while also affecting decision-making and sensitivity to feedback. Taken together, the evidence suggests alcohol can amplify both hunger signaling and the perceived reward value of snack foods.

The effect shows up in behavior, not just in lab chemistry

The food choices tied to alcohol are not random. Nutrition researchers reported that alcohol primers increased explicit liking of high-fat savory foods and increased ad libitum snack intake in experimental settings. The same review also found that poorer inhibitory control was associated with greater cookie consumption after alcohol exposure, suggesting the issue is partly about reduced restraint as well as stronger appetite.

That behavioral effect matters in real life because alcohol is often consumed in settings where calorie-dense snacks are easy to access. A meta-analysis in The American Journal of Clinical Nutrition said lifestyle factors including alcohol appear to increase food intake partly by enhancing food reward value, while also decreasing inhibitory control. In other words, the drink can make the snack more tempting at the same time it makes it harder to stop at a small portion.

Animal research has supplied a possible brain mechanism for that pattern. A 2017 Nature Communications study found that activity in AgRP neurons was required for alcohol-induced overeating in mice, offering evidence that alcohol can activate circuits associated with feeding despite adequate energy intake. Mouse findings do not translate directly into human eating habits, but they support the broader conclusion from human studies that alcohol can push the brain toward eating more, not less.

What it means for everyday eating and drinking

For consumers, the practical takeaway is that post-drink snacking is not just a matter of poor planning or lack of willpower. The research indicates that alcohol may increase appetite signals, raise the reward value of certain foods, and reduce the mental braking system that helps people moderate portions. That combination helps explain why foods like pizza, fries, chips, and other salty snacks often become more appealing after drinks.

What is less clear is whether the response is identical across all people or all drinking patterns. Reviews note that findings on hormones such as ghrelin can be mixed depending on study design, dose, and whether researchers are looking at social drinkers or people with alcohol use disorder. The strongest conclusion supported across sources is narrower: alcohol frequently promotes extra eating, particularly of energy-dense foods, and people often do not offset those calories elsewhere.

Federal health agencies already recognize that alcohol affects multiple body systems, including endocrine and brain processes. The research base does not point to one single switch behind snack cravings, but it does show a repeatable pattern in which alcohol alters both physiology and behavior in ways that make overeating more likely.

13 Foods Doctors Say You Should Drop From Your Diet After 50

processed meats

What you eat after 50 has a different impact than it did at 30. Muscle mass, blood vessel flexibility, blood sugar control, and recovery all become less forgiving, which is why doctors focus less on trendy diets and more on everyday food traps.

The processed foods that age your body faster

Doctors routinely put processed meats near the top of the avoid list after 50, and for good reason. Bacon, sausage, hot dogs, deli turkey, ham, and salami are typically loaded with sodium and preservatives, and both the American Heart Association and Harvard nutrition experts recommend limiting them. This matters more with age because high blood pressure, heart disease, and stroke risk all climb in later decades.

Sugary drinks belong in the same danger zone. Regular soda, sweet tea, energy drinks, and many fruit-flavored beverages deliver a fast hit of added sugar without fiber or meaningful nutrition. The American Heart Association notes that a single 12-ounce soda contains about 10 teaspoons of sugar, making these drinks one of the easiest ways to overshoot daily sugar targets.

Packaged desserts and snack foods also deserve scrutiny. Doughnuts, pastries, cookies, chips, and many ultra-processed crackers are often built around refined flour, added sugar, sodium, and unhealthy fats. The bigger issue after 50 is cumulative: these foods can crowd out protein, fiber, potassium, and other nutrients older adults need more of, not less.

Frozen pizzas, instant noodles, and many canned soups round out this category. They are convenient, but convenience often comes with a major sodium burden. The American Heart Association says about 70% of the sodium in the typical U.S. diet comes from commercially processed and restaurant foods, which helps explain why these staples can quietly worsen blood pressure control over time.

Refined carbs, fried favorites, and breakfast impostors

White bread, white rice, oversized pasta servings, and sugary breakfast cereals are foods many doctors advise cutting back after 50. Harvard nutrition guidance has long warned that refined grains digest quickly, driving blood sugar and insulin higher while offering far less fiber than whole-grain alternatives. For adults already edging toward prediabetes, that pattern can become a daily metabolic strain.

French fries, fried chicken, and other deep-fried foods are another common target. Frying often adds excess calories and unhealthy fats to foods that are already easy to overeat. In real life, these meals also tend to travel with salty sauces and sugary drinks, creating the kind of high-sodium, high-fat combination cardiologists warn about.

Low-fat flavored yogurts, coffee drinks, and “healthy” granola bars can be just as misleading. Many are marketed as smart choices but contain dessert-level sugar. Doctors often tell patients over 50 to ignore front-label promises and check for added sugars, sodium, and protein instead, because appetite may fall with age even as nutrient needs remain high.

Margarines and shelf-stable baked goods made with older-style partially hydrogenated oils have become less common, but trans fat concerns have not disappeared entirely from ultra-processed foods worldwide. More broadly, heart specialists still advise minimizing products high in saturated fat, salt, and added sugar. The lesson is simple: foods sold as convenient or diet-friendly are not automatically protective.

The drinks and habits that become riskier with age

Alcohol often becomes harder to tolerate after 50, even in amounts that once felt moderate. The Dietary Guidelines for Americans say adults who drink should keep it to no more than 1 drink a day for women and 2 for men, but many physicians urge some older adults to go lower because alcohol can interact with medications, disrupt sleep, and worsen blood pressure or reflux.

Oversized restaurant meals deserve a place on this list too, especially burgers, sandwiches, tacos, and combo plates that pack in processed meat, cheese, refined buns, and salty sides. The American Heart Association identifies these kinds of dishes as major sodium contributors in the U.S. diet. For many adults over 50, the issue is not one dramatic indulgence but how often these meals become routine.

So what are the 13 foods doctors most want gone or greatly reduced? Processed meats, hot dogs, bacon, deli meats, sugary drinks, pastries, cookies, chips, canned soups, frozen pizza, instant noodles, refined grains, fried foods, and sugary breakfast products consistently make the list. Different doctors phrase it differently, but the pattern is remarkably consistent: fewer ultra-processed foods, less added sugar, less sodium, and fewer refined starches.

That shift is not about eating joylessly. It is about protecting blood vessels, preserving energy, stabilizing blood sugar, and making room for foods that do more work for you, like beans, fish, vegetables, fruit, yogurt without added sugar, nuts, and whole grains. After 50, the smartest diet changes are usually the least glamorous and the most effective.

3 Restaurant Empires Collapsed in 2026: Here’s What Brought Them Down

bankruptcy

Restaurant bankruptcies rose again in 2026 as chains faced higher borrowing costs, softer consumer spending, and persistent labor and food inflation. That pressure became especially visible in three high-profile collapses: FAT Brands, Salad and Go, and Lena Brands. Together, their filings show how fast growth strategies, tight liquidity, and lender disputes can destabilize even widely known restaurant portfolios.

FAT Brands became 2026’s biggest restaurant restructuring

FAT Brands filed voluntary Chapter 11 petitions on January 26, 2026, in the U.S. Bankruptcy Court for the Southern District of Texas, the company confirmed in a news release. The Los Angeles-based franchisor said its portfolio included more than 2,200 locations worldwide at the time of filing. Restaurant Dive, citing court documents, reported the company entered bankruptcy with roughly $1.4 billion in debt, making it one of the largest restaurant restructurings of the year.

The company said brands including Fatburger, Johnny Rockets, and Round Table Pizza were expected to keep operating during the case. By May, a bankruptcy court had approved multiple asset sales totaling nearly $1 billion, according to Restaurant Dive. National Restaurant News reported lenders agreed to take over large portions of the company through debt-backed transactions, while some smaller brands were sold for cash.

For customers, the immediate effect was limited because the company said restaurants would continue normal operations during the Chapter 11 process. What remained less clear was how ownership changes would affect franchise support, marketing, and long-term development commitments in specific local markets. The company did not publicly release a consumer-facing, location-by-location impact list at the time of the restructuring.

Court filings and trade reporting pointed to several causes. Restaurant Dive reported FAT Brands had spent years building a large portfolio through acquisitions, leaving it with more than $1 billion in debt. The same reporting cited inflation, tariffs, reduced consumer spending, and legal costs tied to ongoing disputes and investigations as added pressure on cash flow.

Salad and Go shut down all remaining stores after filing

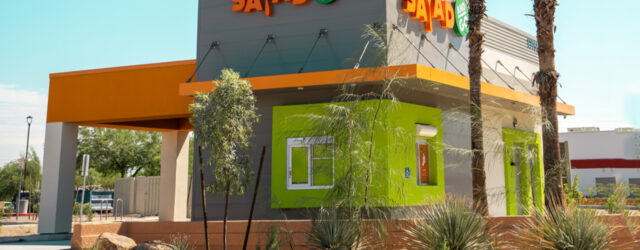
Salad and Go’s operator, And Go Concepts, filed for Chapter 11 protection on August 4, 2026, and the chain closed all 70 remaining restaurants on August 5, according to Restaurant Dive and bankruptcy filing reports published by Omni Agent Solutions. The filing in the Southern District of Texas listed And Go Concepts with estimated assets and liabilities each in the $500 million to $1 billion range. The closure ended operations for what had once been one of the country’s fastest-growing drive-thru salad chains.

The state-level effect was most visible in Arizona, where the brand was founded, but the company also had restaurants and related assets in Nevada, Oklahoma, and Texas, according to Law360 and trade coverage. Public reporting confirmed the total store count that closed, but the company did not release a comprehensive city-by-city closure list in its public statements. That means some local impacts were evident immediately, while a full final accounting by market was not yet publicly detailed.

For customers, the outcome was more abrupt than in other 2026 restructurings because service ended almost immediately. Restaurant Dive reported the company permanently closed all remaining stores rather than keeping units open through a longer reorganization. In practical terms, residents in affected states should expect no further store operations unless assets or leases are later acquired by another operator.

The causes were laid out in reporting tied to the filing. Restaurant Dive and Law360 said Salad and Go cited years of losses, declining demand, rising operating costs, prior expansion challenges, and a sharp traffic drop during the summer 2026 Cyclospora outbreak. Trade coverage also said the company had explored a sale before filing but was unable to complete one.

Lena Brands filed after lenders and a processor froze access to cash

Lena Brands LLC, parent of Shari’s Cafe & Pies and Coco’s Bakery, filed for Chapter 11 on May 15, 2026, in the District of Delaware, according to its Omni restructuring case page. Nation’s Restaurant News reported the filing followed a cash-flow crisis tied to merchant cash advance lenders and a payment dispute involving Stripe. The bankruptcy covered a much smaller operating base than the company’s historical footprint, with later case reporting indicating 11 remaining restaurants in California, Washington, and Idaho.

The local impact was concentrated in the West, especially in Pacific Northwest markets long associated with Shari’s. Public reporting said Shari’s had already closed dozens of restaurants before the Chapter 11 filing, but the company did not publish a comprehensive public list of every affected city. That left some uncertainty for residents trying to track which specific remaining stores, if any, would continue operating during restructuring.

For customers, the most important confirmed fact was that the filing was driven by liquidity, not a broad public announcement of an immediate full-chain shutdown. Nation’s Restaurant News reported that delivery payment flows tied to DoorDash and Grubhub had become central revenue sources, making access to processor-held funds especially important. In communities where units remained open, service continuity depended on the restructuring process rather than a blanket closure order.

The company’s explanation was specific. According to court-related reporting and the restructuring case materials, merchant cash advance lenders asserted claims that triggered a freeze on part of the company’s funds at Stripe, worsening an already fragile cash position. That made Lena Brands a case study in how expensive alternative financing and restricted cash access can quickly overwhelm a restaurant operator with a shrinking store base.

What You Fed Your Kids as a Toddler Might Be Affecting Their Brain Now

toddler diet

New research is sharpening a long-running public health question: how much early childhood diet shapes later development. That focus narrowed this summer with a peer-reviewed study from Children’s Hospital Los Angeles and partner institutions examining whether ultra-processed foods eaten in infancy and toddlerhood were linked to measurable differences years later. The paper adds to a growing body of evidence that food patterns established before kindergarten may still be visible in children’s brains and behavior by school age.

A new study ties early ultra-processed food intake to later brain differences

The specific study at the center of the latest attention is “Early-Life Cumulative Intake of Ultra-Processed Foods and Subcortical Brain Volume at Age Six Years,” published online June 2, 2026, ahead of its August 2026 appearance in The American Journal of Clinical Nutrition, according to PubMed. Researchers followed a prospective birth cohort and evaluated whether cumulative ultra-processed food intake from 6 months through early childhood was associated with cognition and brain structure at later checkpoints.

According to the abstract indexed by PubMed, the study included 144 children for the 24-month cognitive analysis, 93 children for the 72-month cognitive analysis and 79 children for MRI-based brain-volume analysis at age 6. The researchers reported that cumulative ultra-processed food intake was not associated with cognitive performance at either 24 months or 72 months in this cohort. They did, however, find inverse associations between higher intake and volumes in several subcortical brain regions, including the bilateral accumbens, left amygdala, bilateral pallidum, left putamen and bilateral thalamus.

PubMed’s abstract states that, on average, a 10% higher proportion of cumulative ultra-processed food intake was associated with a 1.92% lower subcortical volume. The authors wrote that greater intake from infancy through early childhood was associated with differences in neurodevelopment at age 6, while also calling for future studies to clarify mechanisms and long-term implications. That distinction matters because the study found a structural association, not proof that a toddler diet directly caused later impairment.

What the findings do and do not say for families in the United States

For U.S. families, the clearest confirmed takeaway is not that a single packaged snack in toddlerhood will harm a child’s brain. What is confirmed is that researchers found an association between higher cumulative intake of ultra-processed foods over time and measurable differences in some brain regions by age 6 in the cohort they studied. What is not yet known is whether the same pattern will appear in all U.S. populations, how long those differences persist, or whether they translate into later clinical problems.

The Children’s Hospital Los Angeles-led cohort described in the study involved Latino/Hispanic mother-infant pairs, based on the paper details indexed by PubMed and related institutional summaries. That means the findings are important, but they are not a full national snapshot of every community, income level or eating pattern in the United States. The study also did not show lower test performance on the cognitive measures used at 24 months and 72 months, a point that narrows what can be concluded right now.

Separate research is adding context. A University of Toronto report published March 11, 2026, summarizing a study in JAMA Network Open, said researchers analyzed dietary data from more than 2,000 children at age 3 and later behavioral assessments at age 5. That team found that each 10% increase in calories from ultra-processed foods was linked to higher scores on measures of anxiety, fearfulness, aggression, hyperactivity and overall behavioral difficulties, according to the university’s summary of the study.

Why researchers are focusing on toddler diets now

Researchers and pediatric nutrition experts have been paying closer attention to toddler diets because the early years are when food preferences and eating routines often become established. An American Academy of Pediatrics-related analysis of U.S. toddler diet quality notes that the 2020–2025 Dietary Guidelines for Americans identified a healthy dietary pattern specifically for toddlers 12 through 23 months old, reflecting the policy view that the second year of life is a distinct and important nutrition period. That framework has made it easier for researchers to measure toddler diet quality in more standardized ways.

The latest brain-volume study also fits within a broader nutrition-and-development literature that is increasingly focused on ultra-processed foods rather than single nutrients alone. The authors, as summarized in PubMed, said future work is needed to identify the relevant biological pathways and determine which nutritional factors matter most. That caution is consistent with the paper’s own results, which showed no association with cognitive test performance in the sample even while detecting differences in MRI-measured structures.

For customers and residents reading this as parents or caregivers, the practical implication is limited but clear: this is another data point suggesting that repeated diet patterns in the toddler years may matter later. It does not amount to a recall, safety alert or new federal rule, and it does not establish that specific products cause developmental harm. What it does show, based on newly published and related 2026 research, is that scientists are increasingly treating early childhood nutrition as a measurable part of long-term brain and behavioral health.

NYC’s Best-Kept Grocery Secrets Aren’t What You’d Expect

Nationally, grocery shoppers are still contending with stubborn food-price pressure and a retail landscape split between large chains and smaller specialty operators. In New York City, that has sharpened attention on a different kind of grocery advantage: neighborhood markets that function as price leaders, cultural hubs and supply lines for ingredients many mainstream stores do not stock. The city’s best-kept grocery secrets, increasingly, are not hidden luxury purveyors but immigrant supermarkets that have been serving regular shoppers for years.

The city’s grocery “secret” is scale, specialization and turnover

What stands out in New York is not a single newly opened store but the staying power of supermarkets that built their business around specific communities and high-volume staple shopping. Eater NY reported that Jubilee Marketplace in Greenpoint publicly lowered prices in July 2025 after customer complaints, a notable example of how closely urban grocery operators are responding to price sensitivity. The broader pattern across the city is that stores with fast inventory turnover and focused customer bases can compete on essentials even when national food costs remain volatile.

That dynamic is especially visible in markets that sell region-specific produce, sauces, noodles, seafood and pantry staples in large quantities. Eater’s reporting on specialty grocery shopping in New York highlighted chains and independents such as Food Bazaar in the Bronx and Queens and Hong Kong Supermarket in Chinatown as destinations for shoppers seeking both value and selection. In practice, that means customers often find lower per-unit prices on vegetables, rice, frozen dumplings, herbs and imported condiments than they would at smaller mainstream urban grocers.

The “secret” is also operational. Stores that know exactly what their customer base buys can stock deeply, turn merchandise quickly and limit waste. That matters in a city where refrigeration, rent and labor costs make grocery math especially difficult.

In NYC, the strongest impact is in immigrant neighborhoods and cross-borough shopping

The local effect is most visible in neighborhoods where grocery shopping is tied to community networks as much as convenience. Eater’s reporting on Manhattan Chinatown described the area as a long-running supply hub for Chinese families and workers, with shoppers returning for bok choy, dried mushrooms, sauces and other essentials not easily found elsewhere. That role extends beyond Lower Manhattan into Elmhurst in Queens and Brooklyn’s Sunset Park and Bensonhurst, where Chinese food businesses and grocery ecosystems expanded alongside population shifts.

Queens remains central to that story. Reporting from Eater on the Queens Night Market’s vendor pipeline shows how food businesses tied to immigrant communities can grow from informal or small-scale retail into larger operations, reflecting the borough’s role as an incubator for specialty food commerce. While that article focused on prepared food rather than supermarkets, it underscored the same local reality: Queens shoppers often rely on dense ethnic retail corridors for both affordability and access.

What is not publicly quantified is a citywide count of which stores offer the lowest basket prices neighborhood by neighborhood. No single official source has released a comprehensive list of New York City’s cheapest immigrant supermarkets by borough. But published reporting confirms the spread of these shopping networks across Manhattan, Queens, Brooklyn and the Bronx.

The reason is broader than taste: these stores solve price and access problems

The underlying cause is economic as much as culinary. Eater NY noted in July 2025 that consumers were bracing for further grocery price increases and that tariffs were one factor shaping anxiety about food costs. In that environment, neighborhood grocers that specialize in high-demand staples can attract not just diaspora shoppers but anyone trying to control a weekly grocery bill.

There is also an information gap that helps explain why these stores remain “best-kept” despite their importance. Eater’s reporting on WeChat-based Chinese food communities found that many immigrants and international students trade tips on where to buy specific groceries, from festival foods to regional snacks, through private digital networks rather than English-language media. In other words, some of the city’s most useful grocery knowledge circulates person to person, not through mainstream retail marketing.

For customers, the practical takeaway is straightforward. Shoppers in New York City should expect these markets to remain important sources of value, especially for produce, pantry staples and culturally specific ingredients, even as prices remain under pressure elsewhere. The strongest verified pattern is not a flashy new grocery concept, but the continued relevance of neighborhood supermarkets whose competitive edge comes from volume, specialization and loyal local demand.

3 Florida Restaurant Closures That Left Locals Heartbroken

Independent restaurants across the country continue to face pressure from rising occupancy costs, labor expenses, and tighter consumer spending. In Florida, those strains have translated into the loss of several well-known dining rooms in 2026, including three restaurants that had become fixtures in their neighborhoods. The closures of Lokal in Coconut Grove, City Cellar in West Palm Beach, and Cut 432 in Delray Beach each came with confirmed end dates and publicly reported lease or rent disputes.

Lokal in Coconut Grove closed after 15 years

Lokal, the Coconut Grove burger-and-beer restaurant from Kush Hospitality Group, served its final weekend in late June after 15 years in business. The Miami Herald reported on March 5, 2026, that owner Matt Kuscher announced the restaurant would close because rent on the space was being raised by 50%, which he said made the business unsustainable. Kuscher said in a public post that the restaurant would wind down over the summer, and reference reporting cited June 28, 2026, as the final service date.

The closure affected a restaurant at 3190 Commodore Plaza that had been tied to Coconut Grove’s casual dining identity for more than a decade. Miami Herald reporting described Lokal as the first concept in what became Kush Hospitality, giving the shutdown added significance for the company as well as the neighborhood. The company said staff members would be moved to other projects, including the returning Kush Wynwood concept.

For Coconut Grove, the confirmed local impact was the loss of a long-running independent restaurant in one of Miami-Dade County’s best-known dining districts. What is not publicly documented in a comprehensive way is how many repeat local customers or nearby businesses were affected by the closure beyond general foot traffic. What is clear, based on Kuscher’s statement and the Miami Herald’s reporting, is that rent escalation was the central reason given for the decision.

City Cellar ended a 25-year run in West Palm Beach

City Cellar Wine Bar & Grill closed on May 24, 2026, ending a 25-year run at CityPlace in West Palm Beach. South Florida Business Journal reported in March that the restaurant’s lease expiration would eliminate more than 90 jobs, and later local reporting identified the total as 96 affected employees tied to the closure. Palm Beach-area coverage also confirmed that sister concept Barrio shut down at the same time.

The local effect was unusually visible because City Cellar had operated since the original early years of the downtown retail and dining district. Reports described it as one of the longest-running restaurant tenants in the area, and Big Time Restaurant Group said it planned to place as many workers as possible at other company restaurants nearby. That means some staffing disruption was documented, but not every long-term employment outcome has been publicly detailed.

The cause cited across multiple reports was lease expiration rather than a publicly announced operational failure. The company did not present a broader statewide closure plan, and there is no public indication that other Florida City Cellar locations were involved because this was a single West Palm Beach restaurant. For customers and downtown residents, the practical result is that one of the district’s legacy full-service restaurants is no longer part of the current dining mix.

Cut 432 shut down in Delray Beach amid rent pressure

Cut 432, an upscale steakhouse on East Atlantic Avenue in Delray Beach, closed in spring 2026 after about 18 years in business. Boca-area reporting in June stated the closure had occurred at the end of April, while follow-up reports tied the decision to a major rent increase. Reference reporting and secondary local coverage said the landlord sought an increase of more than $100,000, and ownership opted to leave the location rather than continue under those terms.

In Delray Beach, the closure removed a restaurant that had long been associated with downtown dinners, celebrations, and business occasions. Local reports said ownership was exploring relocation, which means the brand itself was not necessarily ending permanently. Still, as of the confirmed closure, the original Atlantic Avenue address was no longer operating.

The broader context again points to real-estate cost pressure rather than a reported food-safety issue, chain bankruptcy, or statewide retrenchment. Public reporting has not established a full Florida count of related closures because Cut 432 was a single Delray Beach restaurant, not a multiunit chain. For residents, that means the immediate takeaway is local: a recognizable downtown dining room is gone, and any return would depend on a future site that ownership had not publicly confirmed.

This Everyday Food Might Be Quietly Raising Your Kidney Disease Risk

Chronic kidney disease affects millions of Americans, and diet remains one of the biggest modifiable risk factors cited by kidney specialists. A growing body of evidence has narrowed attention to one everyday category found in kitchens, lunchboxes, and convenience aisles nationwide: ultra-processed foods. National Kidney Foundation guidance and a widely cited 2022 study suggest that frequent consumption of those foods may be quietly increasing long-term kidney disease risk.

A major kidney health group tied higher risk to ultra-processed foods

The National Kidney Foundation highlighted the issue on June 6, 2022, when it announced findings from a study published in the American Journal of Kidney Diseases showing a 24% higher risk of incident chronic kidney disease among people with the highest intake of ultra-processed foods. The same study found that each additional daily serving was associated with a 5% higher risk, according to the foundation’s summary of the research.

The foods named in that announcement are staples for many households. The foundation listed carbonated soft drinks, sweet or salty packaged snacks, candies, mass-produced packaged breads, cookies, cakes, margarine, cereals, instant soups and noodles, and processed meat and cheese as examples of ultra-processed foods. That matters because these items are widely consumed and often marketed as quick, affordable options.

Researchers also reported that replacing one serving per day of ultra-processed food with a minimally processed food was associated with a 6% lower risk of chronic kidney disease, according to the National Kidney Foundation. The organization said the findings add to broader evidence connecting heavily processed diets to adverse health outcomes. The study announcement did not identify a single brand or region as the driver of risk, but it did point to a category deeply embedded in the U.S. food supply.

The impact is national, but the exact household exposure varies

For readers in the United States, the practical issue is that the food category linked to higher kidney risk is not confined to specialty junk food. National Kidney Foundation dietary guidance says sodium is commonly found in packaged, restaurant, and processed foods, and it specifically identifies deli meats, canned soups, frozen prepared meals, salty snacks, and convenience foods as items that can strain kidney health.

What is confirmed is that chronic kidney disease risk is closely intertwined with blood pressure and diabetes, two conditions that diet can worsen or help control. The National Kidney Foundation states that too much sodium can contribute to fluid retention, swelling, and higher blood pressure, while high blood pressure itself is a leading cause of kidney disease. That makes many everyday foods relevant even before a person has been diagnosed with kidney problems.

What is not yet known on a household level is which single packaged food poses the greatest standalone risk for an average consumer, because the evidence described by kidney health groups focuses on dietary patterns rather than one product. Public guidance also does not provide a city-by-city or state-by-state breakdown of ultra-processed food exposure. Instead, the available evidence points to cumulative intake across common grocery and takeout habits.

Why experts are focused on sodium, additives, and overall diet patterns

The reason kidney experts keep returning to ultra-processed foods is not just convenience culture. The National Kidney Foundation says processed foods are often high in sodium, and its kidney disease nutrition guidance also flags phosphate additives in deli meats, processed foods, and dark colas as a concern for people whose kidneys are not functioning well. Excess sodium can raise blood pressure and increase fluid burden, both of which add stress to the kidneys.

The foundation’s consumer guidance also links processed dietary patterns to the major diseases that often precede kidney damage. It says diabetes and high blood pressure are the two leading causes of kidney disease, and notes that regularly drinking soda can increase the risk of those conditions. In that sense, some everyday foods may affect kidney health both directly through sodium load and indirectly through related metabolic disease.

For customers, that means the most relevant change is usually not eliminating one item but recognizing how often heavily processed foods appear across the day. The National Kidney Foundation advises reading food labels, comparing sodium levels across brands, and choosing lower-sodium or less processed alternatives when possible. Its current nutrition materials continue to frame balanced, lower-sodium eating patterns as a key part of slowing or preventing kidney disease progression.